Real-time US, in combination with color flow Doppler US, is currently the most frequently used diagnostic imaging modality worldwide in the screening and evaluation of patients with cirrhosis (see the images below).[50, 51, 52, 53, 54] In addition to demonstrating the morphologic characteristics of cirrhosis, including hepatic contour, texture, and the presence of portal collaterals, Doppler US provides useful information on portal hemodynamics.[55, 56, 57, 58]
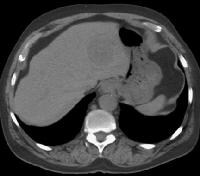
 Female patient with cirrhosis showing "coarsened" echo texture and enlarged left lobe of liver
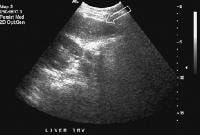 Transverse view, real-time ultrasonogram shows an irregular external contour of the left lobe (arrow).
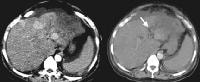
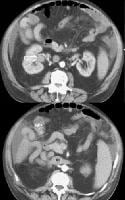
Real-time US can be used to detect ascites and splenomegaly, to differentiate intrahepatic or extrahepatic causes of jaundice, and to detect portal vein thrombosis in patients who have decompensated (see the images below).
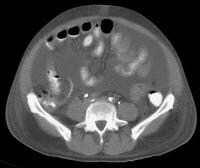
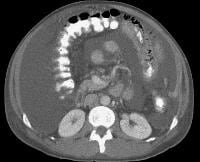
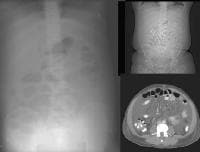
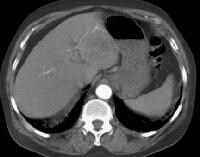
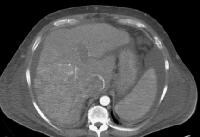
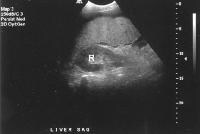 Advanced cirrhosis. A nodular liver, echogenic in comparison to renal parenchyma (R), is seen. Ascites also is present.
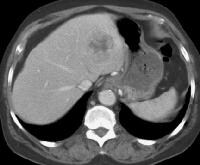
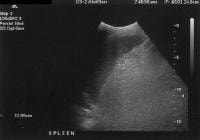 Splenomegaly with longitudinal dimensions of 12.95 cm in a patient with portal hypertension and splenorenal shunt
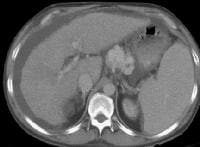
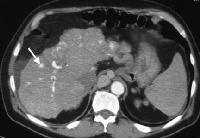
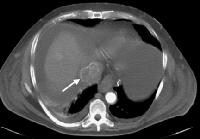
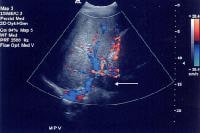
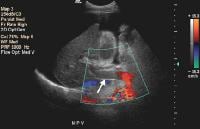 Recent development of a bland portal vein thrombus in advanced cirrhosis, with deficit of a Doppler ultrasonographic signal (arrow). Note the contracted liver and ascites.
Portal blood flow
Doppler evaluation in a patient with cirrhosis can demonstrate high-velocity blood flow in the enlarged hepatic artery, which becomes tortuous as the underlying degree of fibrosis increases (see the image below).
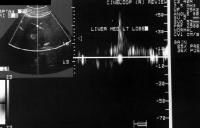
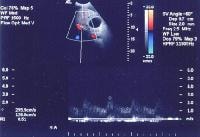 In cirrhosis, flow increases in the hepatic artery. In this patient, maximum flow was measured at 255 cm/sec. The resistive index increases in end-stage liver disease.
PI, a measure of hepatic arterial vascular resistance, is elevated in patients with cirrhosis, and Schneider and colleagues have determined that it correlates quite well with the HVPG.[59]
The normal direction of portal blood flow is maintained initially, but as the degree of cirrhosis progresses, damping of the usual triphasic signal in the intrahepatic veins and loss of respiratory variation in the portal venous system occur. Flow within the main portal vein gradually diminishes; bidirectional and (subsequently) reversal of flow may be seen, usually with accompanying development of collateral vessels, as shown in the images below.
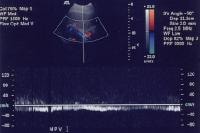 As portal hypertension develops, the flow within portal vessels can reverse as shunts develop. The flow in this patient was reversed in the main portal vein (the flow pattern is below the axis as the blood flow is directed away from the Doppler ultrasonographic probe). The flow was also reversed in the left portal vein (not shown) and in the intrapancreatic portion of the splenic vein (also see the following 3 images).
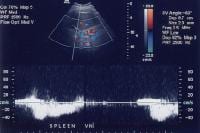 Flow is in the appropriate direction, away from the splenic hilum; however, this is because of the presence of a splenorenal shunt (same patient as in the previous image).
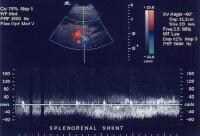 Splenorenal shunt with continuous flow, as demonstrated on a pulse Doppler ultrasonogram (same patient as in the previous 2 images).
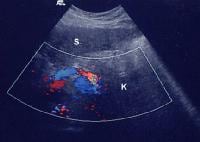 Splenorenal shunt visualized by color flow Doppler ultrasonography (same patient as in the previous 3 images).
Collateral vessels
These collaterals are most frequently detected in the splenorenal region (21%), or as patent paraumbilical collaterals (14%) (see the images below).
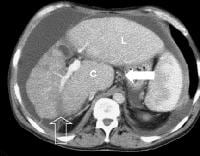
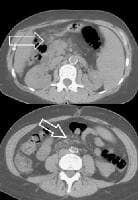
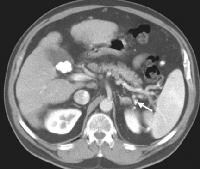
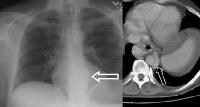
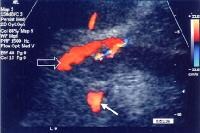 Splenorenal shunt. This color flow Doppler ultrasonogram demonstrates collateral in the perisplenic region (open arrow), with simultaneous flow in the left renal vein (closed arrow). Contiguity was demonstrated on computed tomography (CT) scans.
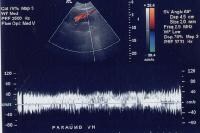 A more advanced example of a patent paraumbilical vein, noted on a color flow Doppler ultrasonographic examination. Note the constant flow pattern on the Doppler flow trace, with a velocity of over 40 cm/sec.
In a study by von Herbay and coauthors of 109 patients with cirrhosis, the presence of collaterals correlated significantly with the presence of ascites, esophageal varices, and the inversion of portal flow, but not with splenomegaly.[58]
Doppler US continues to be used in the noninvasive physiologic evaluation of the portal tract in patients who, in an attempt to reduce the risk of GI hemorrhage, undergo pharmacologic modulation of portal pressures. However, Doppler US does not correlate well with intrahepatic pressures or with the portal systemic pressure gradient. For example, the evaluation of systemic flow in the femoral or brachial artery also has been studied, but only a 50% correlation is observed in reduction of femoral blood flow and portal pressure in response to propranolol treatment.
Effects of pharmacologic agents
The potentially confounding effects of pharmacologic agents on portal and systemic blood flow and resistance, coupled with a wide range of variability in individual response and observer measurements, continue to make this a perplexing area of investigation. A direct correlation of multiple flow parameters to the HVPG remains elusive.
Vascular impedance
Arterial vascular impedance can be estimated as the RI, which represents the ratio of the difference between the peak systolic and end-diastolic velocities to the peak systolic velocity. This can be measured directly in the superior mesenteric or hepatic artery. In addition to pharmacologic agents, however, numerous factors on the capillary and venous side can affect the RI. These include alteration of blood flow in the portal veins following a meal and the extent of development of collateral vessels, in addition to increased resistance from fibrosis or hepatic congestion because of fatty infiltration or right-sided heart failure.
Screening for focal hepatic masses
US has an established role in screening for focal hepatic masses, despite rather low specificity (see the images below).
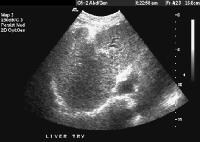
 Screening real-time ultrasonographic study. A triple-phase computed tomography (CT) scan was negative. A guided, ultrasonographic biopsy showed hepatocellular carcinoma in the right lobe of the liver. Note the pseudo-capsule around the lesion (best seen on magnified view).
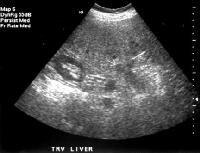 Screening ultrasonogram in a patient with cirrhosis. A gray-scale real-time ultrasonogram shows a relatively hypoechoic region (< 1 cm) near the gallbladder fossa (arrow).
Demonstration of shunt vascularity by Doppler US enables a diagnosis to be made with high specificity (see the images below), but neovascularization occurring in small lesions may be below the threshold of detection of even sophisticated US systems.
 Doppler ultrasonogram. A patient with cirrhosis who has a hypoechoic mass, as detected on a screening ultrasonogram. The cursor placed at the edge of the lesion shows a vascular shunt with a maximum velocity of over 50 cm/sec.
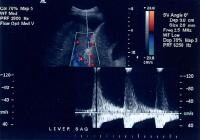 Multifocal hepatocellular carcinoma. The Doppler trace at the margin of the mass shows a shunt vascularity of 120 cm/sec.
Multifocal lesions occasionally may be obscured, but in general, the lesions can be appreciated as tumor masses that either have vascularity or are avascular, but displacing, vessels (see the images below).
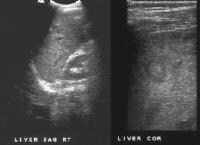
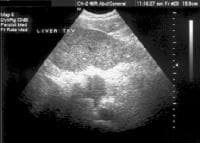 Screening for hepatocellular carcinoma. A real-time limited ultrasonogram shows an inhomogeneous liver. No masses were appreciated.
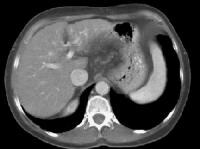
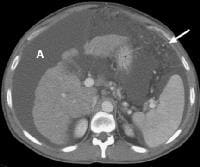
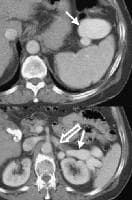
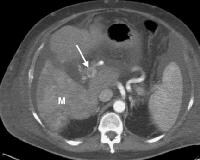
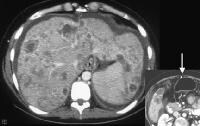
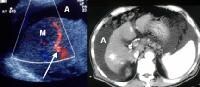 Color flow Doppler ultrasonogram shows a prominent feeding vessel (arrow) and a hypoechoic mass (M), in a patient who has cirrhosis with elevated alpha fetoprotein. Ascites (A) is noted. Computed tomography (CT) scanning confirmed a hyperattenuating hepatocellular carcinoma with satellite nodules in the right lobe of the liver.
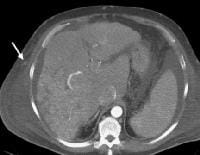
 Multifocal hepatocellular carcinoma in a patient with underlying alcoholic cirrhosis and ascites (A). This color flow Doppler ultrasonogram shows multiple masses (M) displacing vessels within the right lobe of the liver.
Pulse Doppler US is useful in demonstrating shunt velocity, as shown below, which in the author's population has been found to be highly specific for HCCA when in excess of 2.4 kHz.
Doppler ultrasonogram. A patient with cirrhosis who has a hypoechoic mass, as detected on a screening ultrasonogram. The cursor placed at the edge of the lesion shows a vascular shunt with a maximum velocity of over 50 cm/sec.Multifocal hepatocellular carcinoma. The Doppler trace at the margin of the mass shows a shunt vascularity of 120 cm/sec.Portal vein thrombosis
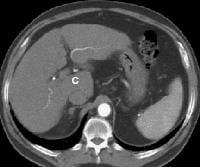
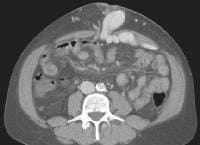
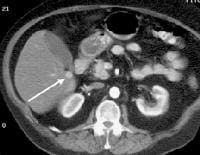
Portal vein thrombosis, shown below, can be diagnosed with relative confidence if a distended portal vein is found that contains echogenic material in the absence of Doppler signal.
Recent development of a bland portal vein thrombus in advanced cirrhosis, with deficit of a Doppler ultrasonographic signal (arrow). Note the contracted liver and ascites.Malignant invasion of the portal vein may be detectable as neovascularity within the thrombus, occasionally with direct contiguity with an intrahepatic lesion. (See the image below).
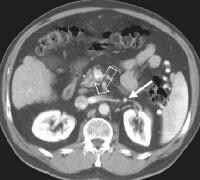
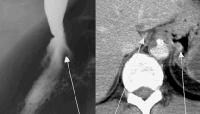
 Color flow Doppler evaluation shows that the main portal vein (arrow) is occluded, with the collateral flow adjacent.
Low flow within the portal vein may be misinterpreted as thrombus, and careful attention to technique is necessary to ensure that the sensitivity of the Doppler signal is optimized.
Harmonic imaging/intravascular contrast agents
The development of intravascular contrast agents (which have little or no toxicity) initiated a re-evaluation of ultrasonographic sensitivity and specificity, which early investigations have suggested are greatly improved. The technical performance of ultrasonographic systems concomitantly has been modified to insonate tissue optimally, as well as to detect and process vascular and parenchymal signals from contrast agents. Techniques that are used include harmonic imaging, which is designed to capture nonlinear resonant frequencies from tissue and microbubbles with enhanced signal compared to background noise.
The microbubbles can be disrupted by insonation at a high mechanical index (MI), which represents the peak negative pressure of the transmitted ultrasonographic pulse, and this produces a strong, very brief echo. The microbubbles can then be visualized at a lower MI intensity (< 0.5) without causing further disruption. The bubbles can be seen within vessels and are detectable within capillaries in which conventional Doppler techniques cannot detect flow.
HCCAs have variable enhancement patterns on contrast-enhanced harmonic US. Homogeneous and heterogeneous enhancement have been described by Kim and colleagues, correlating with CT-scan enhancement patterns.[60]Three of 8 patients in this study also had linear tumor vessels in the lesions, but globular or peripheral enhancement seen in hemangioma and metastases, respectively, were not shown. Wilson and colleagues described perilesional and intralesional vessels. In a pilot study of 3 patients with biopsy-proven HCCA, the authors found variable characteristics, including identification of tumor vessels within the lesion and increased echogenicity within the center of the tumor.
The use of harmonic power Doppler US remains in the investigational phase, as researchers study the impact of technical parameters, such as pulse repetition frequency, wall filter settings, and injection rates on lesion detection. The decreased sensitivity of harmonic power Doppler US, in comparison with conventional power Doppler US on precontrast, is more than compensated for on contrast-enhanced imaging.
Through the evaluation of characteristics related to contrast-enhanced US, including portal-phase enhancement, negative washout (also called negative enhancement), arterial-phase peripheral nodularity and fill-in, and degree of arterial enhancement, algorithms have been developed that allow a logical and accurate differentiation of HCCA from other lesions, such as hemangioma or focal nodular hyperplasia.[61]
In the foreseeable future, the use of contrast in US is expected to reduce the necessity for additional corroborative imaging studies and to increase reliance on this already widely available, reasonably economical, and adaptable modality.
Real-time elastography
Real-time elastography is a promising technique for the noninvasive evaluation of the severity of hepatic fibrosis. This technique has been commercially developed by Hitachi Medical Systems and was used by Friedrich-Rust and colleagues to assess liver fibrosis in 79 patients with chronic viral hepatitis. Using a stepwise logistic regression analysis in patients and controls to define a tissue elasticity score, diagnostic accuracy was 0.75 for significant fibrosis, 0.73 for severe fibrosis, and 0.69 for cirrhosis, with a highly significant correlation (Spearman's correlation coefficient = 0.48) between the elasticity scores and the histologic fibrosis stage.[62]
Role of US in biopsy and ablative therapy
The fact that US is readily available and can be used in the guidance of percutaneous biopsy and of ablative ethanol or acetic acid injection of focal lesions, as well as the fact that it can be employed in conjunction with radiofrequency (RF) probes for thermal ablation, means that selected patients to be evaluated, diagnosed, and treated using 1 modality. The use of US contrast agents (SonoVue®) has been helpful in differentiating viable from necrotic tissue, thereby improving diagnostic accuracy, particularly for lesions under 2 cm. Wu and coauthors achieved a better diagnostic accuracy for lesions that were evaluated by contrast enhancement prior to biopsy than for those that were evaluated with unenhanced US (97.1% vs 78.8%).[63]
In a representative study by Livraghi using percutaneous ethanol ablation, 5-year survival rates for patients with HCCA lesions that were smaller than 5 cm and who suffered from Child C, B, or A cirrhosis were 0%, 29%, and 47%, respectively.[64] Poorer results were obtained for multiple tumors or in the presence of portal thrombosis.
Degree of confidence
The presence of portal hypertension can be inferred based on the measurement of portal vein diameter; a sensitivity of 75% and a specificity of 100% for a diameter greater than 1.3 cm have been claimed. As previously noted, however, measurements of flow and vessel diameter are only indirectly related to portal pressure, and the degree and level of intrahepatic obstruction (presinusoidal or postsinusoidal), arterial flow to the liver, and capacitance of the collateral flow may affect flow parameters. Other findings, such as loss of respiratory variation in the diameter of the main portal vein or the presence of collaterals, are considered by Zimmerman and coauthors to be approximately 80% sensitive.[65]
Such a wide range of variability exists among patients that measurements of this nature should be considered useful only in research settings. If no other corroborative evidence has been obtained, caution should be used in interpreting these measurements as determinants of the presence of portal hypertension.
Ultrasonographic characteristics
The ultrasonographic characteristics of HCCAs are variable, reflecting the diversity of neoplastic differentiation. However, certain pathologic characteristics occur with greater frequency and are helpful in characterizing hepatic lesions on ultrasonographic examination. For example, a pseudocapsule may be identified as a halo on ultrasonographic imaging. Neovascularity with arterial-venous shunting, the hallmark of malignant transformation, can be identified by current ultrasonographic systems once a lesion has reached approximately 2 cm. Contrast agents that increase the signal-to-noise ratio enable tumor vascularity to be detected with greater sensitivity.
Ultrasonographic sensitivity
In patients with cirrhosis attributed to multiple risk factors, Fasani and colleagues report that, compared with CT scanning, US appears to understage patients with multinodular lesions.[66] The sensitivity of US is also reduced in patients with heterogeneous livers. This understaging may be significant when considering patients for transplantation or ablative therapy, indicating that corroborative imaging with MRI or CT scanning may be of benefit in patients with advanced cirrhosis or a multifactorial etiology.
US combined with intravascular contrast agents
US appears to be very promising, particularly when combined with intravascular microbubble contrast agents, in assessing the effectiveness of tumor ablation. Choi studied the tumor characteristics of 40 patients with 45 nodular HCC lesions 1-3.8 cm in diameter.[67] The patients were undergoing US-guided, percutaneous RF ablation with power Doppler US before and after intravenous injection of a microbubble contrast agent. In 33 of the 45 HCCAs, intratumoral flow was seen at power Doppler US before the administration of a contrast agent. After administration of the contrast agent, an increase in the degree of visualized flow was observed.
After RF ablation, none of the ablated tumors showed intratumoral flow signals at unenhanced power Doppler US, whereas 6 showed marginal intratumoral flow signals at contrast agent–enhanced power Doppler US. This correlated with enhancing foci that were suggestive of viable tumor in corresponding areas, as found at immediate follow-up with contrast-enhanced CT scanning. Thus, these preliminary data suggest that contrast-enhanced power Doppler US can be a promising noninvasive technique for assessing therapeutic response.
False positives/negatives
Regenerative nodules, dysplastic nodules, focal fat, and fatty sparing may mimic focal HCCA. Other nonmalignant hepatic neoplasms, such as hemangioma, may appear similar to HCCA, although arteriovenous (AV) shunts are uncommon. Focal nodular hyperplasia and liver cell adenoma may have extensive AV shunting, with this occurring most often in females.
The development of US contrast agents should further increase sensitivity; evidence suggests that the combination of advanced ultrasonographic imaging techniques (harmonic imaging) can increase the conspicuity of liver lesions (hence, the sensitivity of US when combined with microbubble contrast).