Cirrhosis of the liver is the end stage of a complex process—resulting from hepatocyte injury and the response of the liver—that leads to partial regeneration and fibrosis of the liver.
Cirrhosis poses a difficult challenge for management, while the disease's prevention, detection, and therapy engender major health costs. Diagnostic imaging offers diverse modalities for use in the noninvasive evaluation of the liver, as well as in interventional techniques; the latter may be used to treat such complications as portal hypertension and neoplasia. The diagnosis, management, and treatment of cirrhosis are reviewed in this article.
Anatomy
Hepatic morphologic changes
Regardless of etiology, gross morphologic changes of cirrhosis are recognized by a variety of image techniques. Enlargement of the left lobe and caudate lobe, believed to be the result of lobar-relative regeneration rather than fibrosis, secondary to an accident of vascular supply, is recognized by any cross-sectional technique, such as computed tomography (CT) scanning, magnetic resonance imaging (MRI), or ultrasonography (US), each depicted in the images below.
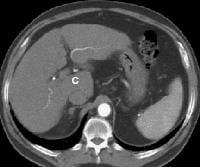 Patient with cirrhosis showing tortuous hepatic arteries in addition to enlarged left lobe and caudate (C)
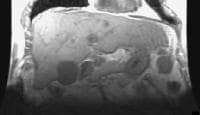 Coronal localizer magnetic resonance imaging (MRI) scan shows marked enlargement of the left lobe of the liver in another patient with cirrhosis.
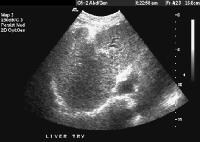 Female patient with cirrhosis showing "coarsened" echo texture and enlarged left lobe of liver
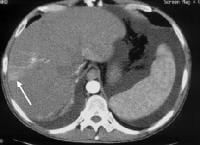
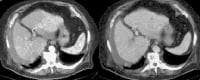
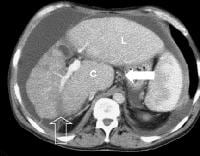 More advanced cirrhosis. Computed tomography (CT) scan with a portal venous–phase image shows a markedly enlarged left lobe (L) and caudate (C), with an area of focal fibrosis and atrophy of the posterior right lobe, deforming contour (open arrow). Incidental note of prominent collaterals in lesser curvature region (white arrow)
Using MRI, Okazaki and colleagues determined that alcoholic cirrhosis is associated more frequently with caudate lobe enlargement and the presence of a right posterior hepatic notch than is virus-induced cirrhosis.[1] Harbin, Hess, Giorgio, Torres, and their coauthors have described a number of indices, including the ratio of transverse caudate lobe width to right lobe width, multidimensional caudate lobe indices that can be obtained by US or CT scanning, and volume analysis of each liver segment, based on cross-sectional area by CT scanning or MRI.[2, 3, 4, 5] Lafortune and colleagues suggested that a reduction in the medial segment of the left hepatic lobe diameter is a helpful adjunct finding of cirrhosis in ultrasonographic investigation.[6]
Another sign of cirrhosis, the expanded gallbladder fossa sign as depicted in the image below, has been described on MRI examination, based on an evaluation by Ito and coauthors of 190 patients with cirrhosis and of 123 control patients.[7] The authors' criterion was enlargement of the pericholecystic space (ie, gallbladder fossa)—which had to be demarcated laterally by the edge of the right hepatic lobe, medially by the edge of the lateral segment of the left hepatic lobe, or posteriorly by the anterior edge of the caudate lobe—in conjunction with nonvisualization of the medial segment of the left hepatic lobe on the same axial image. This achieved a sensitivity, specificity, accuracy, and positive predictive value for the MRI diagnosis of cirrhosis of 68%, 98%, 80%, and 98%, respectively.
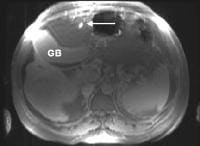 The expanded gallbladder fossa sign has a limited sensitivity (68%) in cirrhosis but is highly specific The authors described an enlarged, pericholecystic, fat-filled space that often contains collaterals (note the patent paraumbilical vein [arrow]), with no visualization of the medial segment of the left lobe of the liver at the level of the gallbladder fossa.
On ultrasonographic examination, the liver contour may appear nodular, as in the first image below, although Ladenheim and colleagues have questioned the specificity of this sign. Similar contour deformities, depicted in the second image below, are evident on examination by CT scanning or MRI. The echo texture appears coarsened. Increase in echogenicity, shown in the third image below, is caused by fatty infiltration, which may be diffuse in hepatitis or focal in hepatitis or cirrhosis.
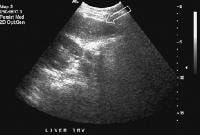 Transverse view, real-time ultrasonogram shows an irregular external contour of the left lobe (arrow).
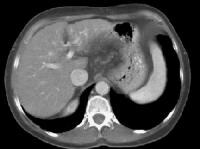 Computed tomography (CT) scan demonstrates irregularity of the external contour of the left lobe.
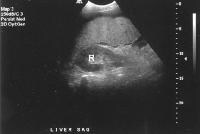 Advanced cirrhosis. A nodular liver, echogenic in comparison to renal parenchyma (R), is seen. Ascites also is present.
Intrahepatic vascular changes in cirrhosis
In cirrhosis, the dynamics of the hepatic arterial and portal venous circulation change as the degree of fibrosis progresses, as depicted in the image below.
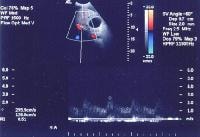 In cirrhosis, flow increases in the hepatic artery. In this patient, maximum flow was measured at 255 cm/sec. The resistive index increases in end-stage liver disease.
In addition, the vessels appear to elongate and become more tortuous because of the underlying parenchymal architectural distortion. This is recognized classically in angiography as "corkscrewing" of vessels and can be appreciated on cross-sectional imaging, depicted below.
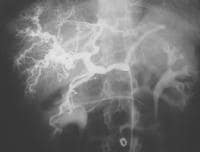 Typical appearance of cirrhosis (in a 22-year-old female) on angiography. Injection of the celiac trunk demonstrates an enlarged hepatic artery. Intrahepatic branches are tortuous, with a "corkscrew" configuration.Patient with cirrhosis showing tortuous hepatic arteries in addition to enlarged left lobe and caudate (C)
Secondary manifestations of cirrhosis may be seen as morphologic or physiologic evidence of the disease. The development of spontaneous shunts has been described in advanced cirrhosis and was initially demonstrated by angiography, although it is now demonstrable by noninvasive techniques, such as Doppler US as in the image below, at an incidence of up to 7%.
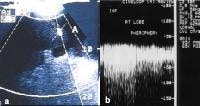 Spontaneous arteriovenous shunt in cirrhotic patient. Color flow Doppler ultrasonogram (a) of the right lobe of the liver demonstrates no focal mass and trace ascites (A), with region of interest shown for pulse Doppler trace (b) showing presence of shunt up to velocities of 170 cm/sec.
Dual-phase CT scanning can demonstrate these shunts as early opacification of the intrahepatic veins during the early arterial phase-injection, portrayed below. The shunts are often accompanied by geographic, wedge-shaped perfusion abnormalities.
 Nontumorous arterioportal shunts occur spontaneously in cirrhosis. Occasionally, the configuration is more rounded, mimicking hepatocellular carcinoma. In this case, a spontaneous shunt is demonstrated as a wedge-shaped region of enhancement (arrow) in the periphery of the right lobe, noted only on early arterial-phase imaging.
Extrahepatic manifestations of cirrhosis detectable by imaging techniques
Marshak, Karahan, and coauthors reported a higher frequency in the alteration in the thickness of the wall of the GI tract, depicted below, in patients with cirrhosis than in controls (64% vs 7%).[8, 9]
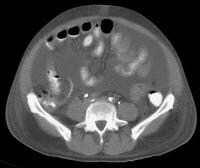 Secondary manifestations of cirrhosis include thickening and edema of the small and large bowel, as well as of the gallbladder wall, which is more common in the setting of ascites and hypoproteinemia. A thickened small bowel is demonstrated here in a 51-year-old patient who has cirrhosis with marked ascites.
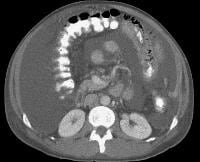 Computed tomography (CT) scan demonstrating edema of the colon in a patient with cirrhosis. Note the presence of marked ascites.
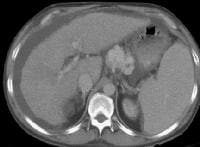
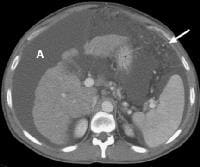 Portal venous–phase computed tomography (CT) scan demonstrating a thickened gallbladder wall, splenomegaly, numerous collaterals within the omentum (arrow), and marked ascites (A). The liver is atrophic and irregular in its external contour.
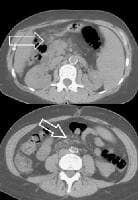 Extrahepatic manifestation of cirrhosis. Mesenteric edema and stranding is identified (open arrow). (Note marked splenomegaly.) Same patient: A computed tomography (CT) scan at more inferior level, the root of the mesentery, shows infiltration around the superior mesenteric vein and artery (arrow).
The development of splenomegaly and collaterals from portal hypertension is readily evident when any cross-sectional technique is used. Nodular iron deposition within the spleen, as seen on seen on MRI scans (Gamma-Gandy bodies), is highly suggestive of portal hypertension.
Functional imaging techniques, such as the use of technetium-99m (99m Tc)–labeled sulfur colloid, which is taken up by reticuloepithelial cells, and the presence of "colloid shift" to the bone marrow in cirrhosis, in addition to the recognition of hepatic morphologic changes and splenomegaly, have been helpful in confirming the presence and severity of cirrhosis, as in the image below.
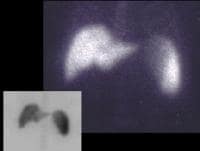 A 56-year-old male with cirrhosis secondary to alcohol abuse. Technetium-99m (99mTc) sulfur colloid (6 millicuries) was administered intravenously. Planar images demonstrated splenomegaly with no focal defects. A single-photon emission computed tomography (SPECT) study showed a mild radiocolloid shift to the spleen and bone marrow, indicating the presence of "mild" portal hypertension.
Portal hypertension
Portal hypertension occurs once portal pressures reach 5-10 mm Hg above normal as a complication of cirrhosis. The well-recognized effect of increasing portal pressures is the development of splenomegaly, depicted below, and collateral portal-venous anastomoses, which occur at numerous sites, including gastroesophageal, paraumbilical, perirectal, and retroperitoneal locations.
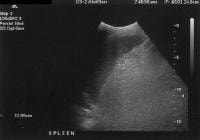 Splenomegaly with longitudinal dimensions of 12.95 cm in a patient with portal hypertension and splenorenal shunt
Varices are not found where the portal vein pressure (indirectly measured as the hepatic vein pressure gradient [HVPG]) is less than 12 mm Hg. However, not all patients with elevated portal pressures develop variceal bleeding. Noninvasive diagnostic imaging methods, such as color flow Doppler US, contrast-enhanced CT scanning, and MRI, can be used to identify the presence of collaterals, as in the images below, but a major limitation is an inability to employ them in evaluating variceal pressures, which correlate more directly with the risk of hemorrhage.
 Development of extensive collateral vessels at the lower esophagus, short gastric vessels places this 42-year-old patient with cirrhosis and portal hypertension at risk for a GI hemorrhage. Note ascites and marked splenomegaly.
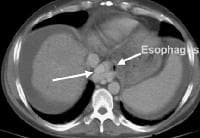 Same patient as in the previous image, section more cranial. Varices are adjacent to and within the esophageal wall.
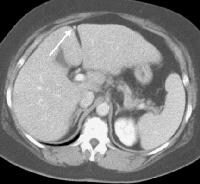 A patent, collateral paraumbilical vein (arrow) arising in the ligamentum teres is an indication of the early development of portal hypertension in a 56-year-old female patient with cirrhosis. This can be traced to the umbilicus and its anastomosis with systemic, superficial abdominal wall vessels in image below.
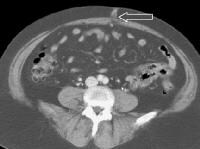 Portal venous–phase computed tomography (CT) scan. Note the superficial vessel (arrow) anastomosing with the paraumbilical vessel (same patient as in the previous image).
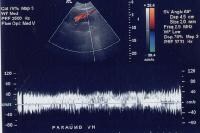 A more advanced example of a patent paraumbilical vein, noted on a color flow Doppler ultrasonographic examination. Note the constant flow pattern on the Doppler flow trace, with a velocity of over 40 cm/sec.
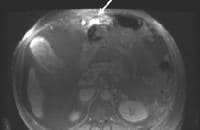 Magnetic resonance imaging (MRI) study. Ascites is present. Patent paraumbilical vessels appear as a bright signal intensity in the periumbilical region (arrow).
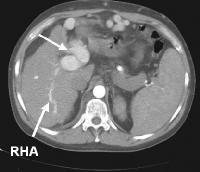 In this computed tomography (CT) scan of a patient with long-standing cirrhosis, the arterial-phase image is indicated by enhancement of the aorta and hepatic arteries (enlarged, tortuous right hepatic artery [RHA], arrow). The intrahepatic left portal vein also is opacified (arrow), as are numerous enlarged paraumbilical collaterals. Simultaneous enhancement of arterial and portal structures on the early arterial-phase images indicates the presence of a large arterioportal venous shunt. Marked splenomegaly is present. Note also the prominent superficial veins in the abdominal wall.
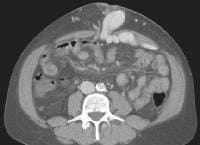 Same patient as in the previous image, section more caudal. The image shows a very large varix in the umbilical region (clinically evident as a caput medusa).
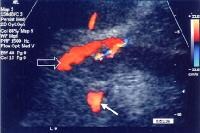 Splenorenal shunt. This color flow Doppler ultrasonogram demonstrates collateral in the perisplenic region (open arrow), with simultaneous flow in the left renal vein (closed arrow). Contiguity was demonstrated on computed tomography (CT) scans.
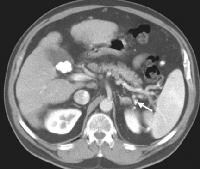 Splenorenal shunt. Collateral vessels are identified medial to splenic hilum and anterior to upper pole left kidney (arrow). Note gallstones, which are frequently present in patients with cirrhosis.
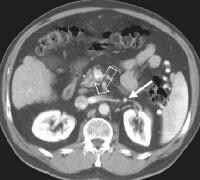 Splenorenal shunt. A collateral vessel passes caudally (arrow) and enters the left renal vein (open arrow) (same patient as in the previous image).
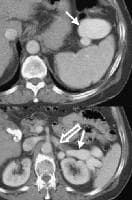 A more advanced example of a spontaneous splenorenal shunt, in a patient with alcohol-related cirrhosis. Upper figure: A large, dilated collateral vessel is present anterior to spleen (arrow). Lower figure: Collateral vessels contiguous with the perisplenic collateral vessel (arrow) feed into the left renal vein (open arrow).
Endoscopic evaluation provides a visual window on esophageal varices, which can be graded for prognosis. However, noninvasive techniques are useful in demonstrating collateral vessels beyond the reach of the endoscope. The images below depict 3-dimensional CT scanning, which is particularly helpful in demonstrating the development and pattern of collateral flow in portal venous hypertension.
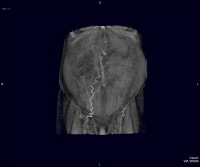 Maximum intensity projection (MIP); reformatted computed tomography (CT) scan showing extensive superficial paraumbilical collaterals in a cirrhotic patient with portal hypertension. The collaterals are extensively anastomosing with the systemic venous system through the internal epigastric veins.
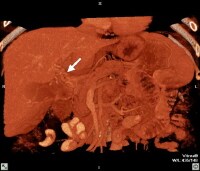
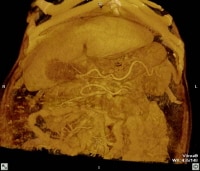 Three-dimensional reformat of a computed tomography (CT) scan shows the morphologic appearance of cirrhosis: a prominent left lobe and portal venous collateral vessels.
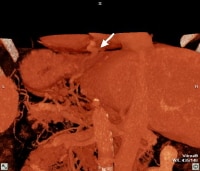 Three-dimensional reformat of a computed tomography (CT) scan of a cirrhotic patient shows prominent collateral vessels arising from the portal system and extending to the GE junction (arrowed).
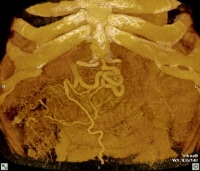 Three-dimensional reformat of a computed tomography (CT) scan of a cirrhotic patient who has portal hypertension with prominent, paraumbilical collateral vessels.
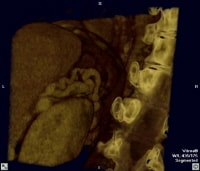 Three-dimensional reformat of a computed tomography (CT) scan showing prominent splenorenal collaterals adjacent to the superior pole of the left kidney
Slow portal flow can mimic portal vein occlusion on cross-sectional imaging, and care must be taken when interpreting images in which not all diagnostic criteria are met. Long-standing thrombosis may be associated with cavernous transformation in which periportal collaterals re-establish flow to the liver, even in the setting of cirrhosis and elevated sinusoidal pressures. Neoplastic invasion of the portal veins must be differentiated from bland thrombus, as in the images below.
 Three-dimensional reformat of a computed tomography (CT) scan showing cavernous transformation in a cirrhotic patient who developed bland portal venous thrombosis. Note the serpiginous collateral vessels (arrow) in porta hepatitis.
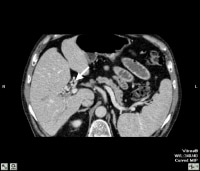 Computed tomography (CT) scan through the porta hepatis shows portal vein thrombosis and collateral vessels in cavernous transformation (arrow).
Preferred examination
Ultrasonography is the most widely used worldwide imaging modality and is used in combination with serum alpha fetoprotein (AFP) screening, based on evidence that increased frequency of examination leads to detection of hepatocellular carcinoma (HCCA) at an earlier stage. It is common practice to screen patients with chronic hepatitis and/or biopsy-documented cirrhosis annually or semiannually with these techniques, although in the United States the American Gastroenterological Association (AGA) does not officially endorse this practice. The accuracy of US, as with CT scanning and MRI, is more limited in the advanced stages of cirrhosis. A US study from Korea, with transplant correlation in 52 patients, demonstrated a sensitivity for the detection of HCCA of only 33% (6 of 18) lesions.
CT scanning is believed to be equivalent in sensitivity to, and more specific than, US. However, there are disadvantages related to contrast risk and radiation exposure, particularly if the modality is used over a lifetime for screening. Thus, CT scanning should be reserved for equivocal cases or for patients in whom disparate results are observed. For example, a heterogeneous appearance on US evaluation of the liver, as shown below, may mask malignant lesions and justify additional imaging.
 Multifocal hepatocellular carcinoma in an elderly patient with cirrhosis who is presenting with fever. The arterial-phase image demonstrates regions of hypervascularity in both lobes of the liver, that do not persist into the portal venous–phase images. The portal vein is not occluded. Ascites is present.
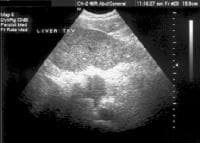 Screening for hepatocellular carcinoma. A real-time limited ultrasonogram shows an inhomogeneous liver. No masses were appreciated.
Conversely, persistent lesions that are noted on US, even if not confirmed on a CT scan, probably should be biopsied, particularly in the setting of serologic abnormalities, as depicted in the image below. In end-stage patients who are destined for transplantation, the sensitivity of CT scanning is reduced (to as low as 37% in one series).[10] .
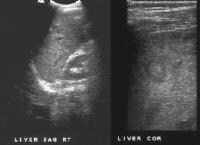 Screening real-time ultrasonographic study. A triple-phase computed tomography (CT) scan was negative. A guided, ultrasonographic biopsy showed hepatocellular carcinoma in the right lobe of the liver. Note the pseudo-capsule around the lesion (best seen on magnified view).
MRI with gadolinium (or other contrast agents) can be used as an alternative (although more costly) study. Similar to US and CT scanning however, a reduction in sensitivity to below 50% has been reported, particularly for lesions under 2 cm, in patients with end-stage disease.[11, 12] Even more invasive and sophisticated techniques, such as CT scanning performed with a catheter in the hepatic artery, as well as angiography, are usually reserved for use in patients undergoing evaluation for transplant at regional centers, where the goal is to exclude or establish the presence and multiplicity of malignant lesions for pretransplant assessment. These techniques are not routinely employed in the United States but are used extensively in Asia.
Unfortunately, for cultural reasons, orthotopic liver transplantation is not routinely performed in these countries; thus, pathologic correlation is limited to hepatic resections and biopsies. However, with the rapid increase in right lobe liver donation surgery, the pathologic correlation should be excellent because the entire explanted liver will be available.
Limitations of techniques
Real-time US is used extensively for screening, but biopsy or additional imaging modalities are required for confirmation. US is a nonspecific test and identifies many nodules, ranging from regenerative nodules, dysplastic nodules, and focal fat to benign neoplasms, such as hemangioma, many of which have no uniquely discriminating features on US.
Because these occur with significant frequency, they pose a diagnostic challenge. For example, in a study of screened patients with cirrhosis, the authors discovered that although combined assessment with US and AFP was accurate in identifying patients with HCCA (who formed 24% of the study's population), 25% of patients had benign focal masses, such as hemangioma or focal fat, requiring further imaging evaluation, and another 20% had focal lesions that could not be corroborated on other imaging studies or on subsequent US. This relatively high prevalence of benign lesions in patients with cirrhosis appears to be corroborated by a study by Horigome and colleagues.[13]
Therefore, it is necessary to commit either to the biopsy of all persistent lesions or to the corroboration of them prior to biopsy with other techniques, such as CT scanning (helical or multislice) or MRI, using dynamic imaging with contrast to obtain multiple vascular-phase images. Clinician preferences in the United States, as surveyed by Chalasani and coauthors, suggest an empirical trend toward routinely incorporating CT scanning in screening.[14]
Some cause for optimism is warranted in terms of reduction in the incidence of HCCA in patients with hepatitis C following interferon therapy. A meta-analysis by Papatheodoridis and colleagues of 11 studies involving more than 2000 patients determined that the incidence of HCCA in patients who underwent interferon therapy was reduced to 8.2%, compared with 21.5% in untreated patients, and was even lower in sustained responders (0.9%).[15]
A major unresolved problem is the evaluation of the efficacy of screening and the economic consequences of aggressive screening. Bolondi and coauthors, in Italy, and Larcos and colleagues, in the United States, estimated that each case of HCCA that is detected costs $8000-$24,000.[16, 17]
Despite the best efforts of the worldwide medical community in screening for HCCA, no evidence exists that mortality has been affected, because therapeutic options, although expanding, remain relatively limited. Survival in patients undergoing liver transplant who have unsuspected HCCA is adversely affected by tumor recurrence (reported in a French series by Adam and colleagues as reaching 5%).[18] The presence of neoplasm is not a contraindication to transplant, although survival in patients with tumors larger than 3 cm, with multiple nodules or portal invasion, is sufficiently impacted to preclude consideration in this subgroup.
Intervention
Of those patients with cirrhosis and varices, 25-40% experience bleeding. The management of portal hypertension and upper tract GI bleeding has been revolutionized by endoscopic and angiographic treatment. The use of the intravascularly placed transjugular intrahepatic portosystemic shunt (TIPS) has provided a second-line therapy for the management of portal hypertension, with reduced mortality and morbidity compared with that associated with the open surgical procedure.
Fischer, Kimura, and coauthors have used noninvasive modalities, such as Doppler US, portrayed below, to monitor shunt patency (with a reasonably high accuracy of greater than 90%).[19, 20] Occasionally, however, conventional Doppler techniques fail to image signals. Thus, enhancement by US contrast agents appears promising in improving visualization, as shown below.
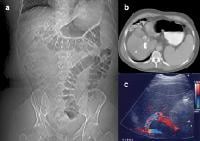 Transjugular intrahepatic portosystemic shunt (TIPS) therapy for the treatment of refractory ascites; a 48-year-old male with intractable ascites and recurrent pleural effusion from a pleuroperitoneal fistula (see Images 40-41). A TIPS procedure was performed. A follow-up computed tomography (CT) scan 9 months later showed the TIPS catheter placed between the inferior vena cava and the middle hepatic vein, as well as resolution of the ascites and effusions (a). The patency of the shunt was confirmed by contrast enhancement on CT-scan and Doppler ultrasonographic evaluation (c), which showed the flow within shunt.
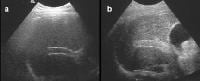 Transjugular intrahepatic portosystemic shunt (TIPS) catheter patency; precontrast, harmonic ultrasonographic image (a). Following a high mechanical index pulse (1.3), microbubble destruction occurs and the microbubbles can be seen within the TIPS on a real-time image, appearing as a highly echogenic signal within the shunt (b).
Patient education
For patient education information, see the Hepatitis Center and the Liver, Gallbladder, and Pancreas Center, as well as Hepatitis A, Hepatitis B,Hepatitis C, and Cirrhosis.
Tidak ada komentar:
Posting Komentar